4Play platform
Home, casino, live casino, bonuses, deposit, sports, blog and location check for a regulated brand, improved in cycles: research, behavior data, hypothesis, A/B test, design, build and a careful read of the results.
- My role
- Product designer for the platform and its design system: research, behavior analysis, Figma design, build follow-up and KPI review.
- The problem
- Players had to get from the first visit to sign-up and a first deposit without getting stuck, find the right game among hundreds and understand bonus rules without reading long terms. Every change also had to prove it improved the experience, not just that it landed on a good week.
- What I did
- I set up a continuous improvement loop: map competitors, read real behavior in Clarity, turn what I saw into hypotheses, test alternatives with A/B tests, ship with the front-end team and follow the KPIs until real impact was separated from coincidence.
- Result
- Desktop, tablet and mobile screens built from reusable components and shipped on 4Play. Onboarding brought in more sign-ups, the path to a first deposit got shorter, and every new improvement started from data instead of opinion. The same system later powered Pagol.
- A decision I'd defend
- Separating real impact from coincidence. Campaigns, big matches and payday move the numbers all the time, so I never treated a single spike as a win. I always compared variant against control over the same period, checked different user segments, and only rolled a change out when the effect held. Some ideas that looked great in Figma were dropped at this step, which saved development time.
How I worked
Each area went through the same loop, round after round.
- Market and competitor researchI reviewed regulated Brazilian operators and international ones: home structure, lobby, sign-up, deposit and how bonuses are explained. I separated the patterns players already know from the gaps we could own.
- Real behavior in ClarityHeatmaps, click density, rage clicks, dead clicks and scroll depth showed where players got stuck, what they ignored and how far down a page they actually read. Session recordings confirmed each friction point.
- Interests and user profilesI combined navigation data with interest surveys to understand each profile: people who come for sports, people who go straight to the casino, people who return for a promotion. Those profiles set content and layout priorities.
- Hypotheses and A/B testsEvery problem became a hypothesis with a success metric set before the test: CTA clicks, completed sign-ups, first deposit, return visits.
- Alternative versions in FigmaI designed variations of hierarchy, layout and components inside the design system, ready to test side by side.
- Shipping with the front-end teamI handed off specs, states and edge cases, then followed development with the front-end team and reviewed every build before it went live.
- Tracking KPIsAfter launch I tracked sign-ups, first deposits, engagement per area and Clarity behavior to check whether the change did what it promised.
- Review and fixesWhen the build drifted from the design or the data showed new friction, I asked for fixes and went back into the loop.
- Real impact or coincidenceI compared variant and control over the same period and by segment before drawing any conclusion, so a campaign, a big match or a seasonal spike was never credited to the design.
- Structuring the next roundWhat worked became a design system component, what didn't became a documented lesson, and the next round started already ranked by impact.
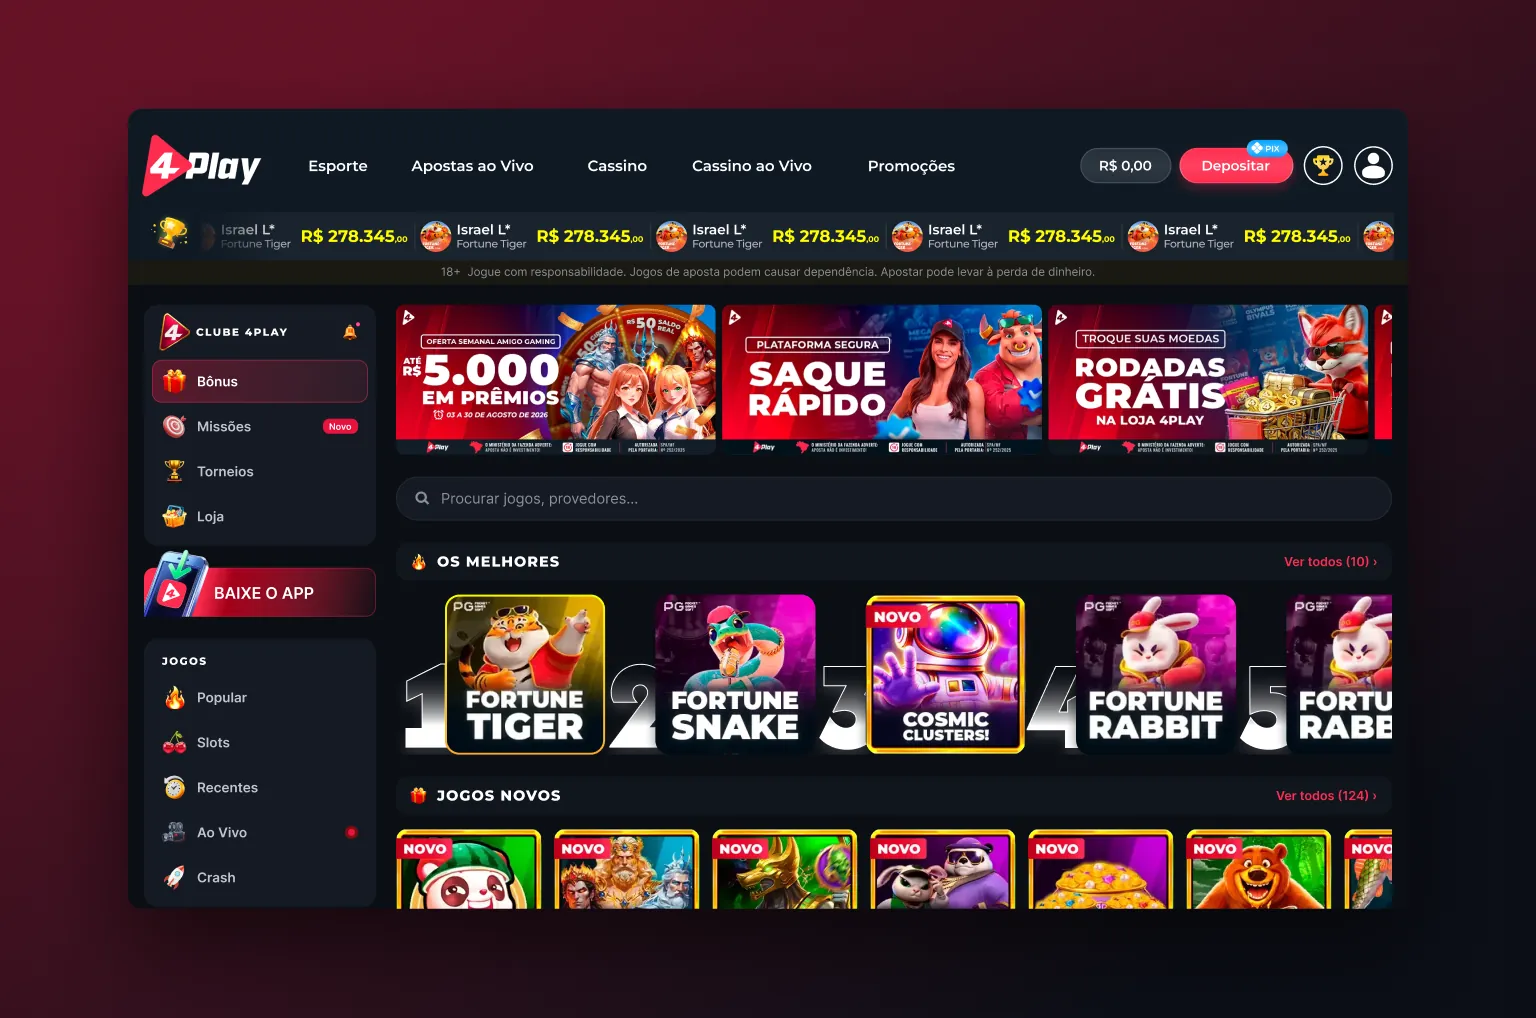
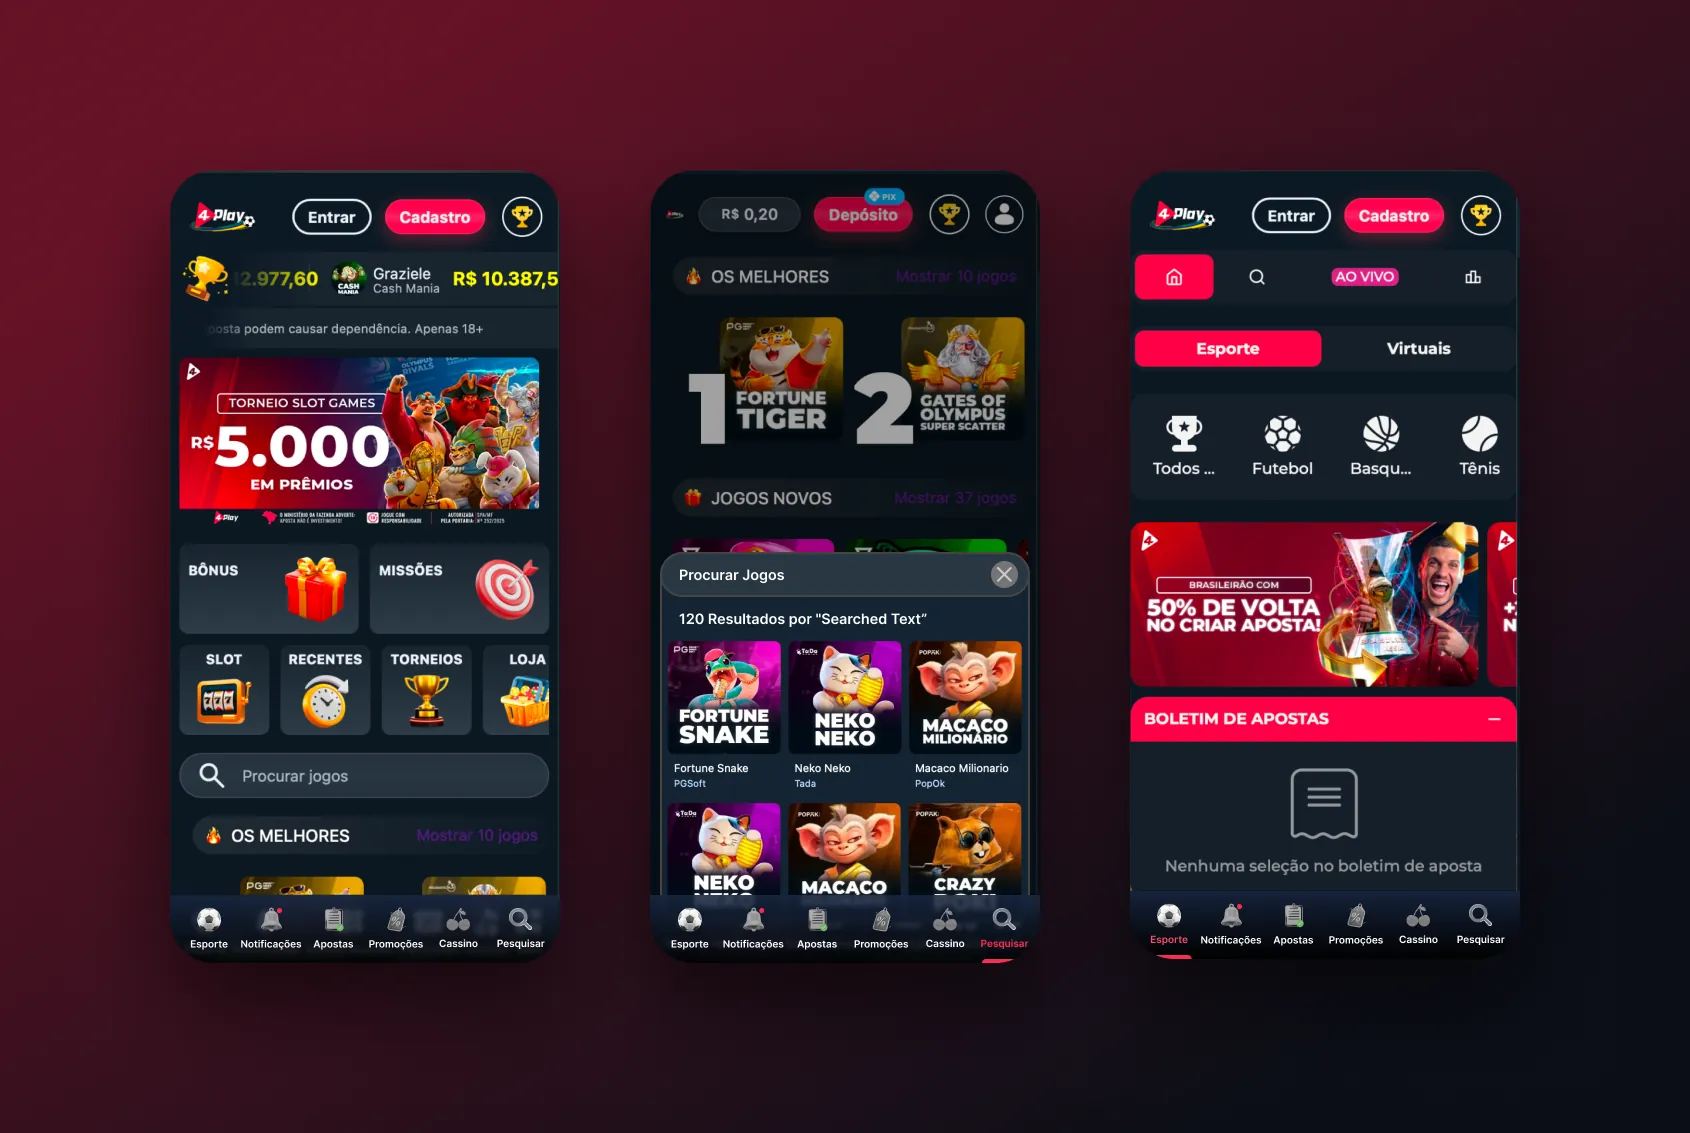
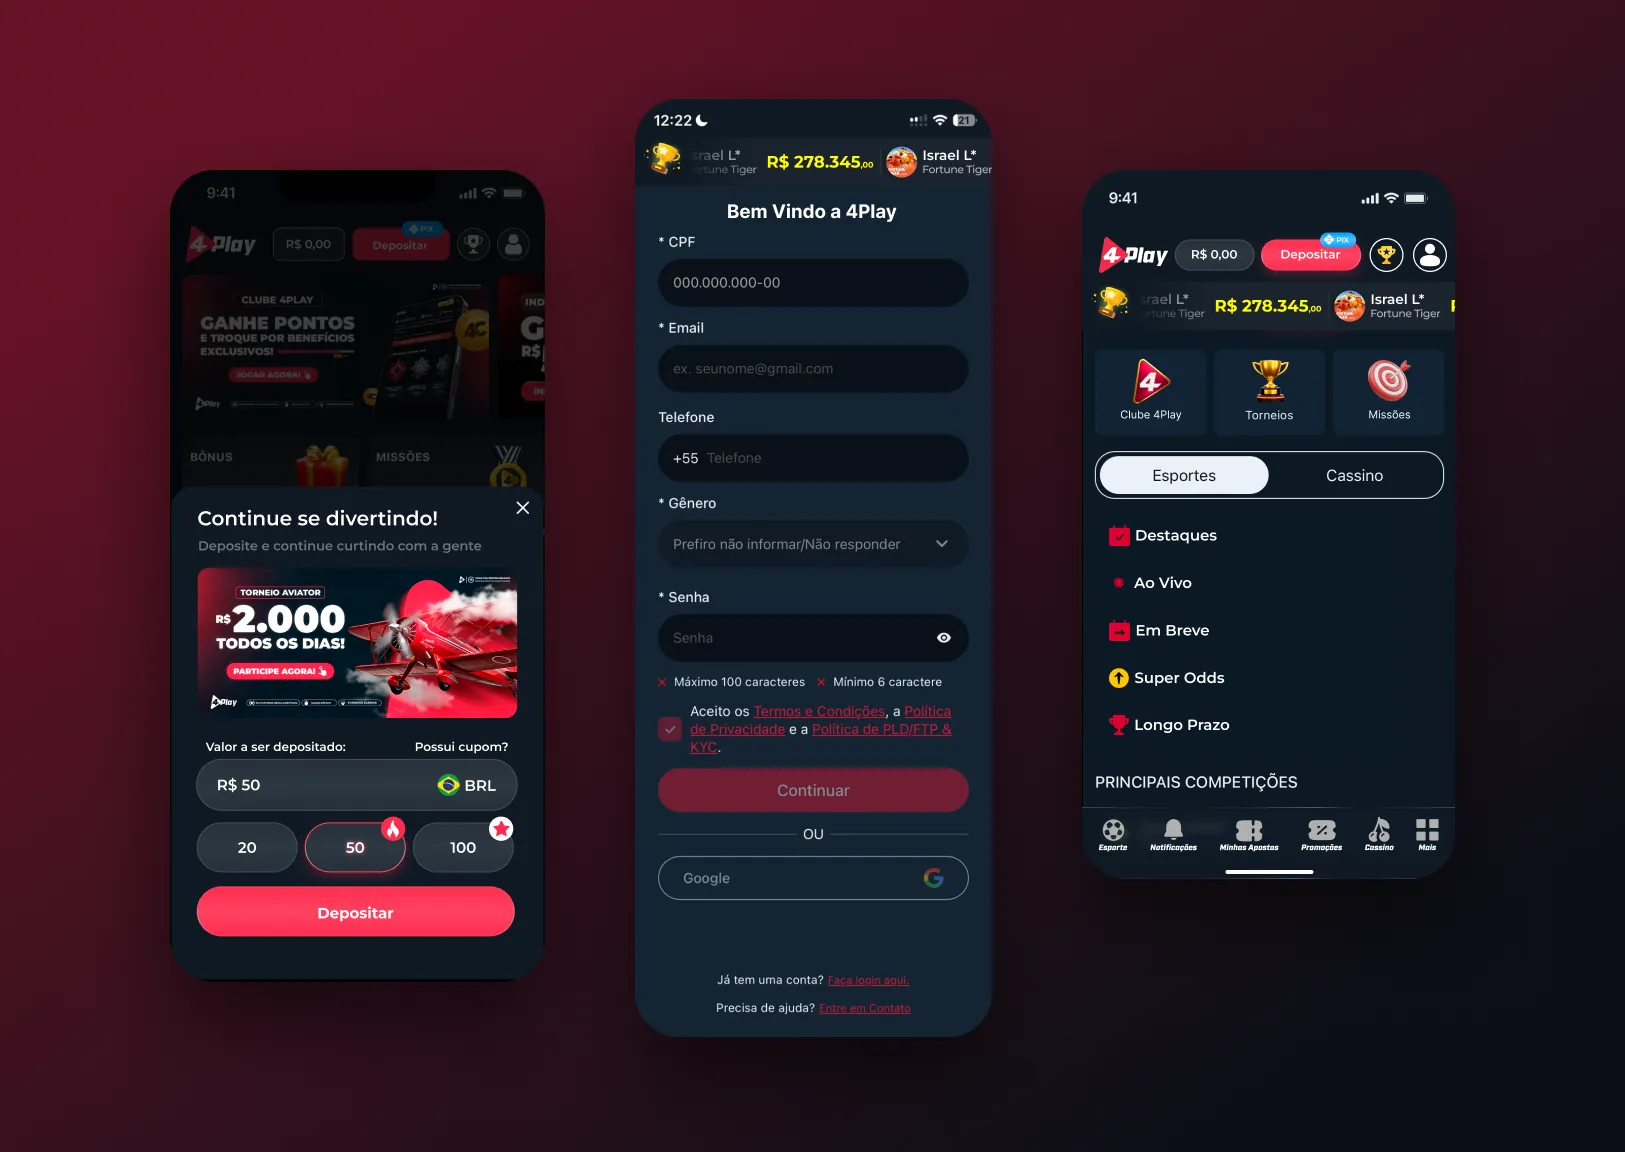
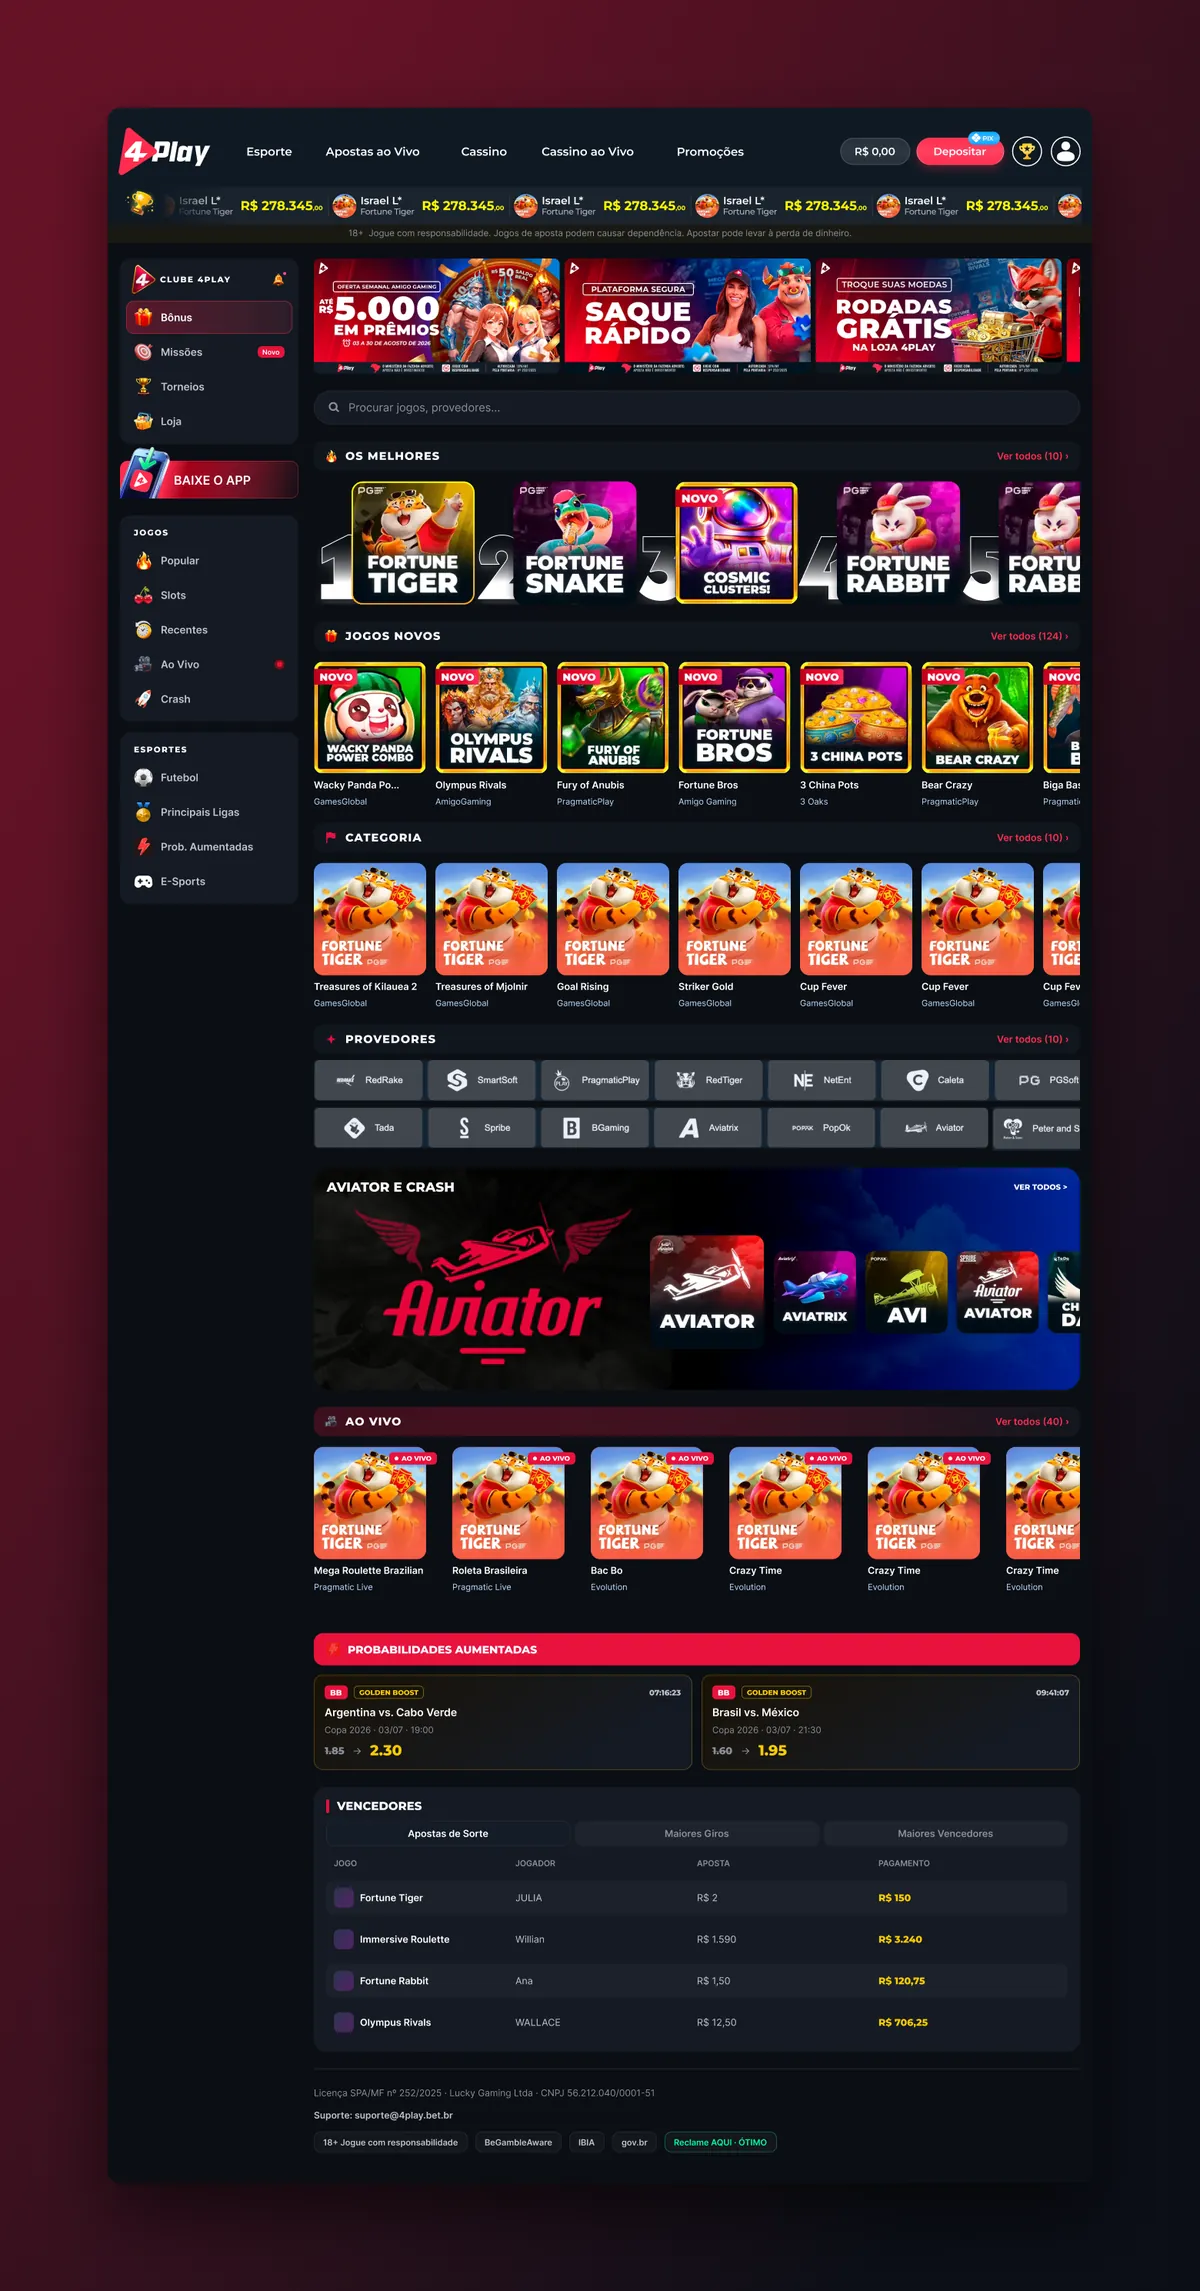
Home and onboarding
The first screens decide whether a visitor signs up. Clarity scroll depth and click maps set what goes above the fold, and A/B tests decided the order of banners, shortcuts and game rows.
 View full page ↗
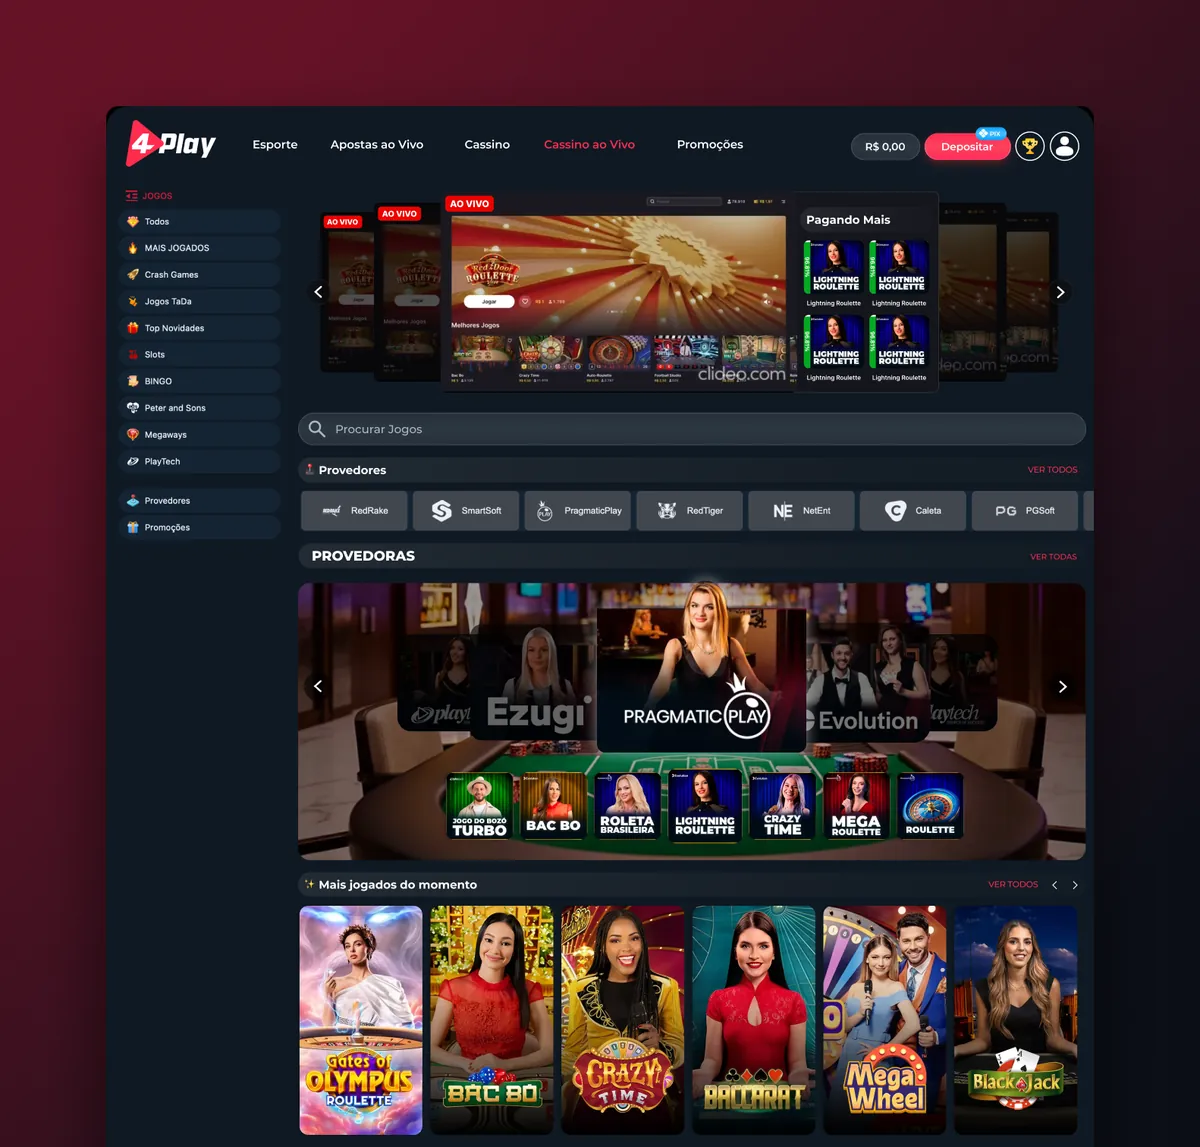
Casino and live casino
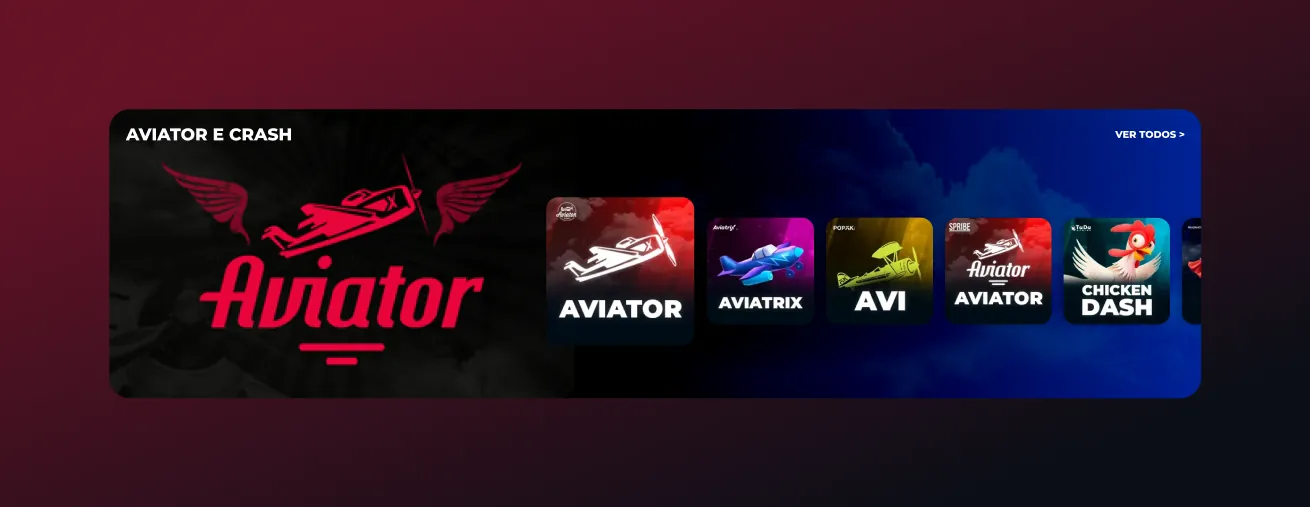
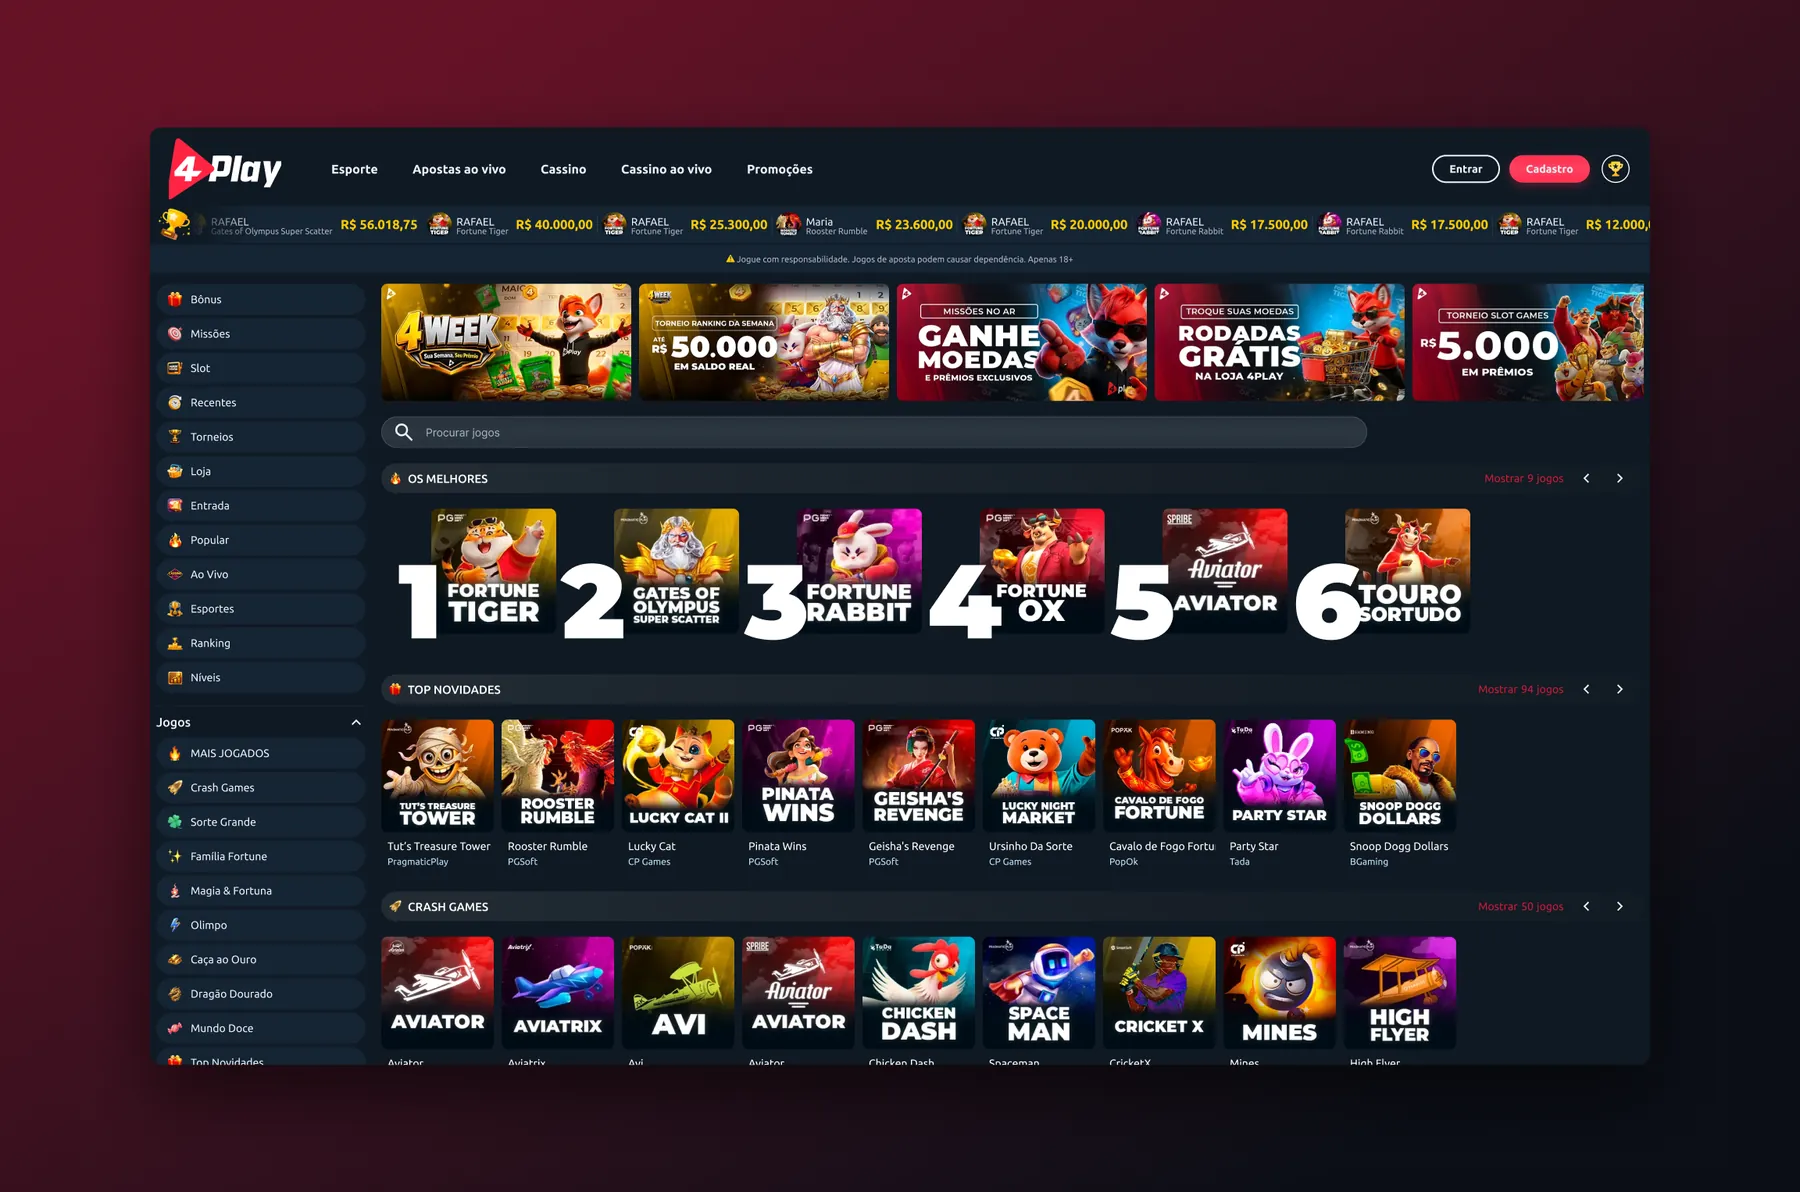
Hundreds of games without clutter. Rage clicks on filters and dead clicks on game cards showed where people got lost, so categories, search and quick-read rows came first.
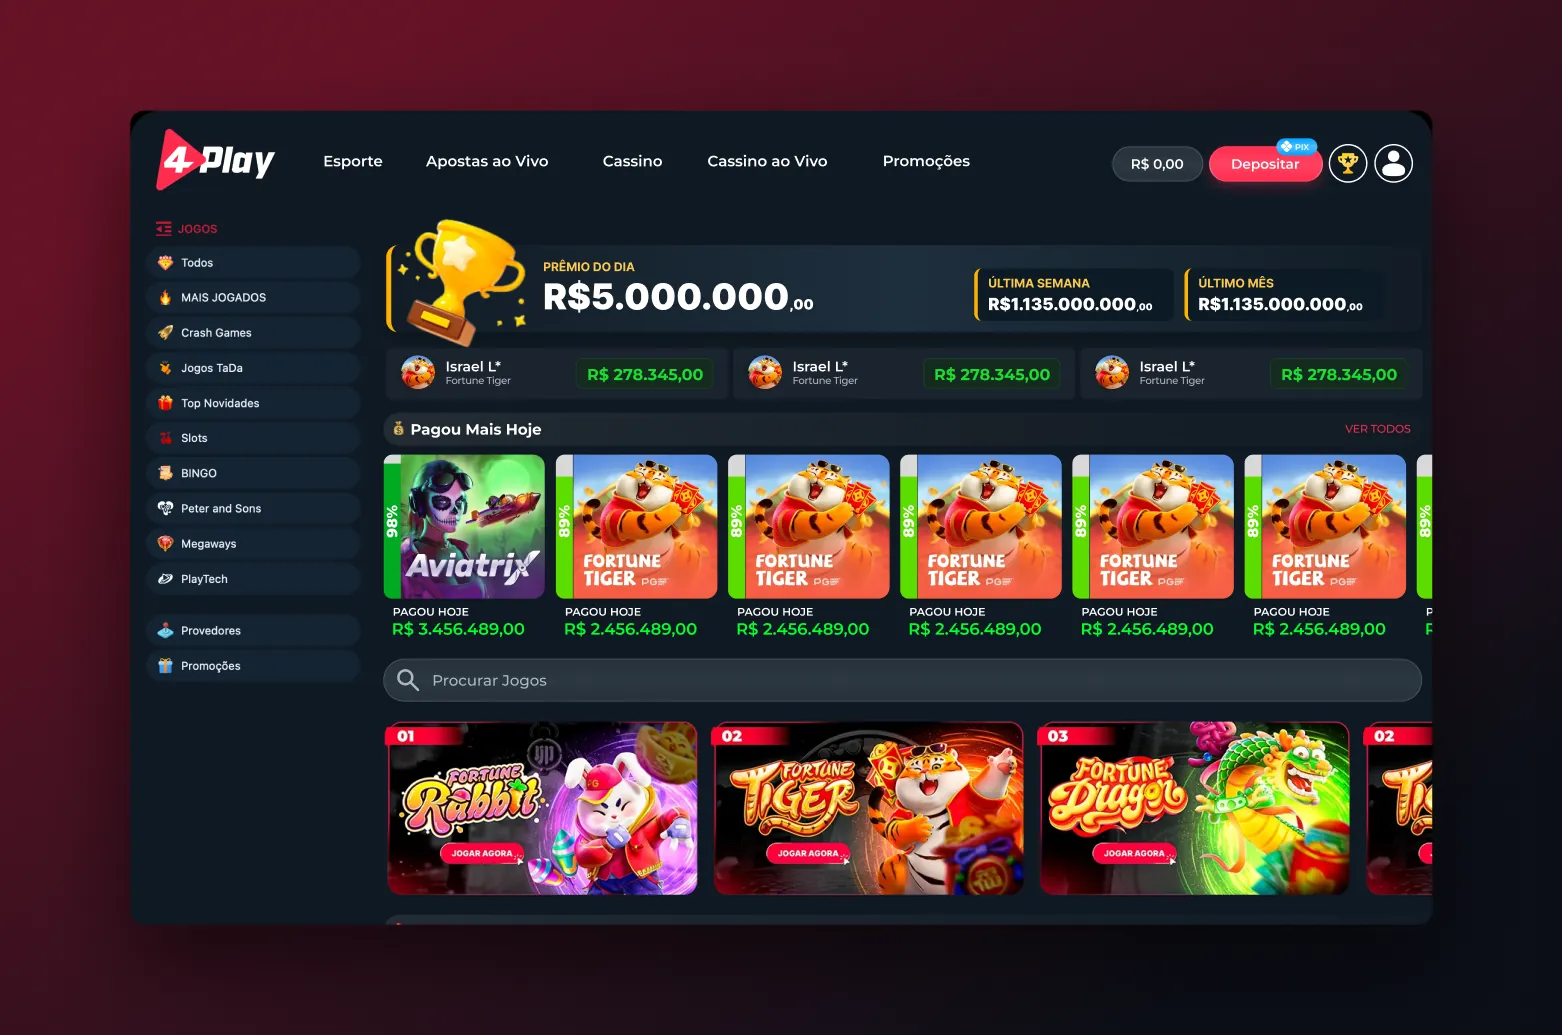
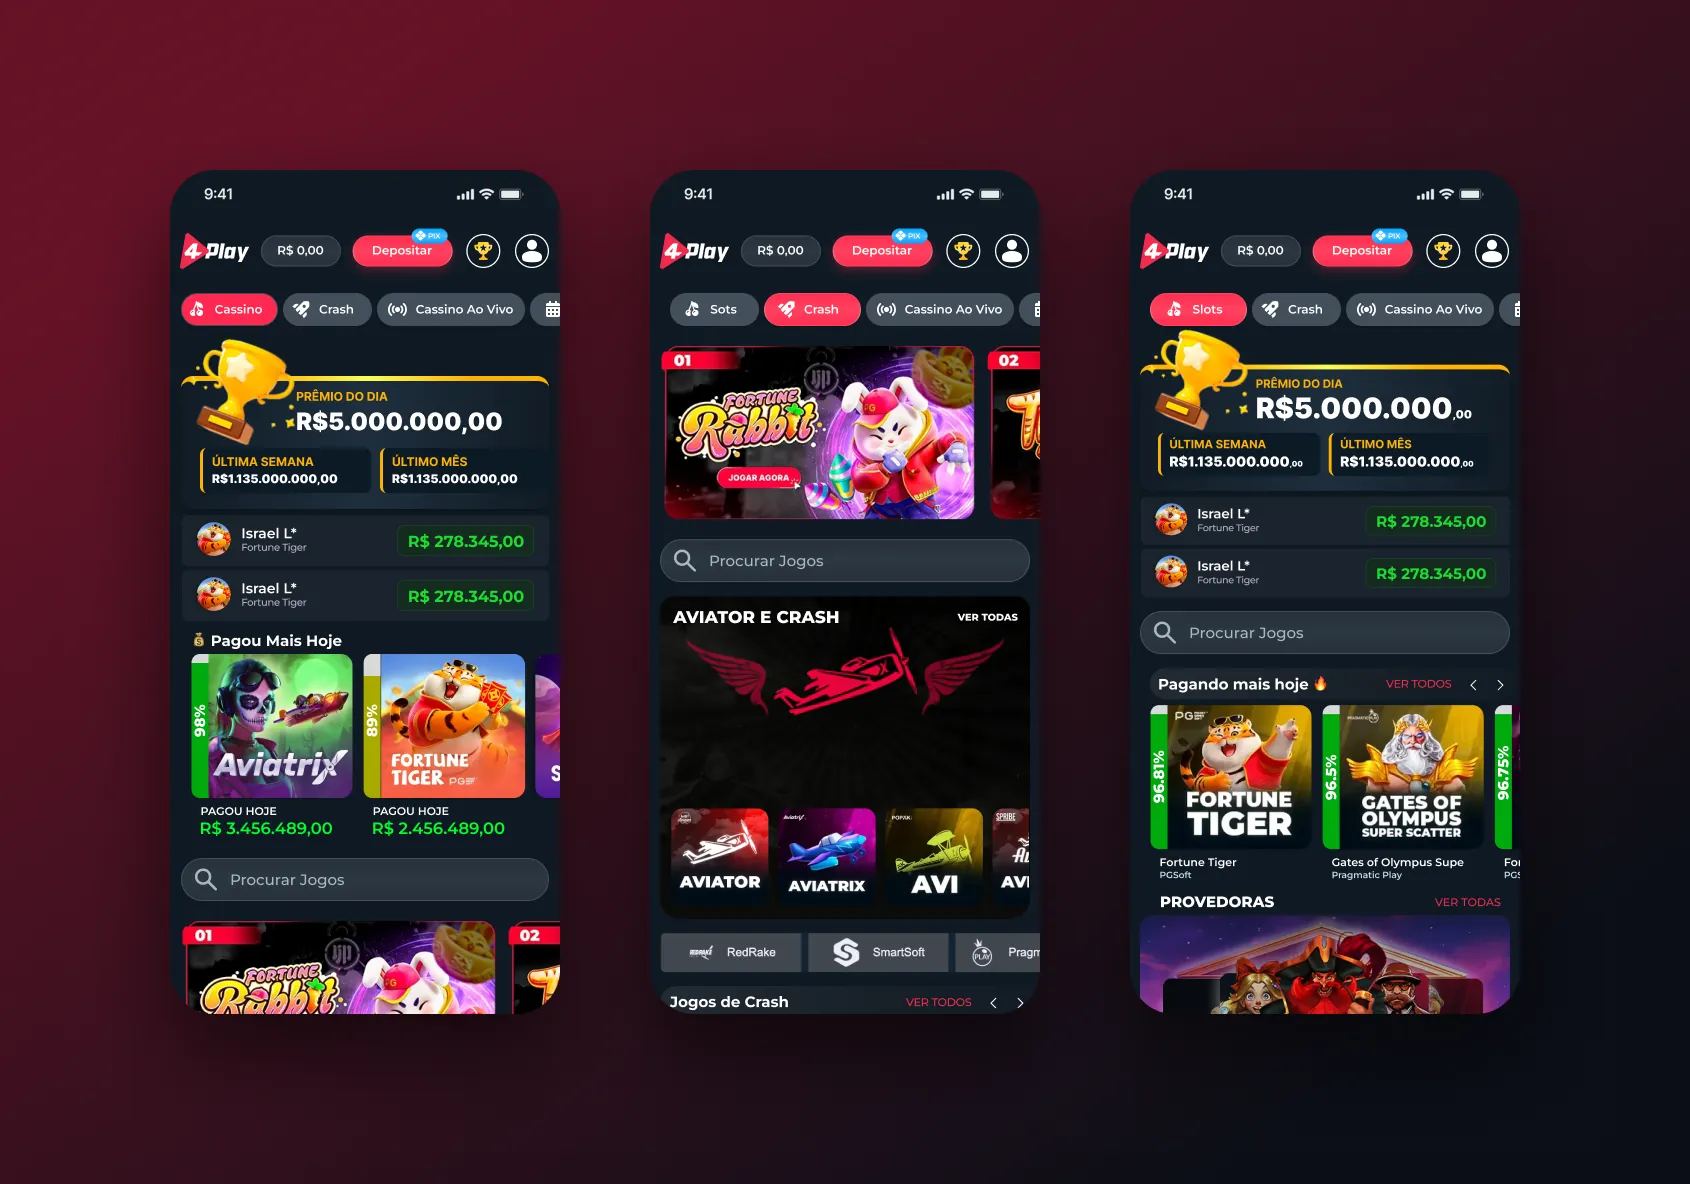
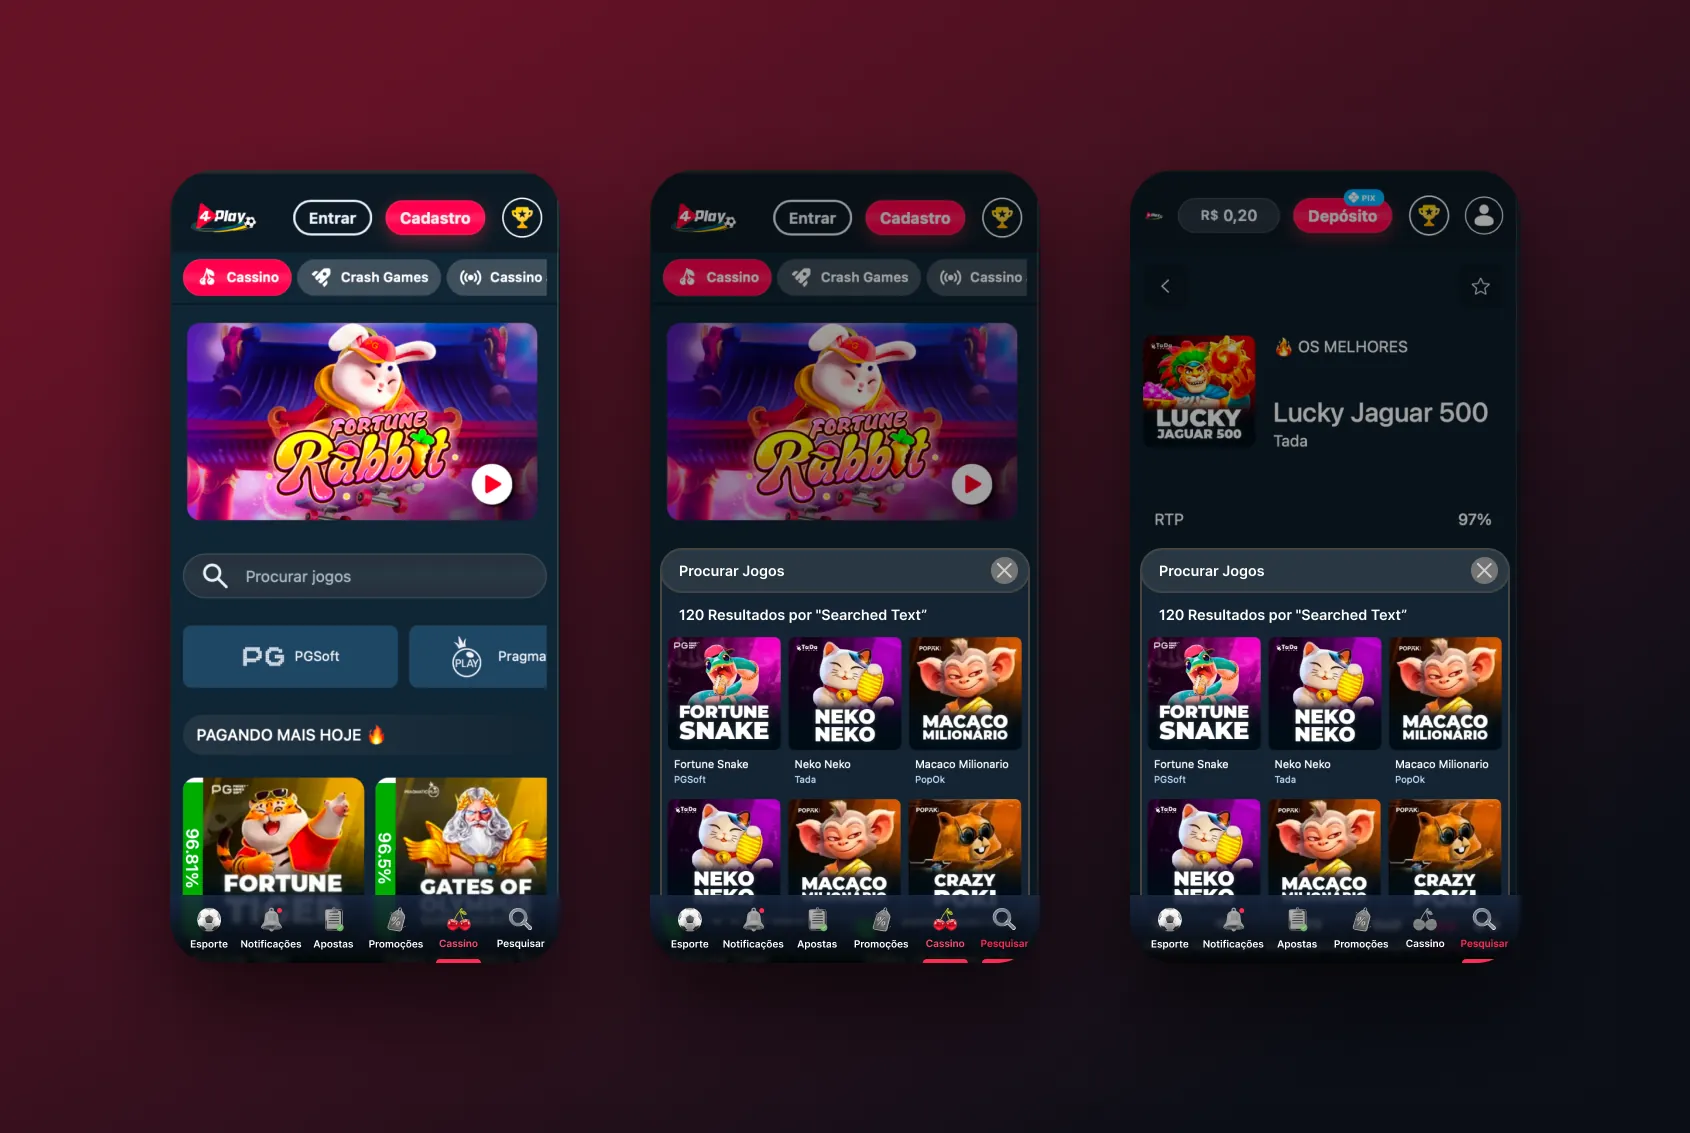
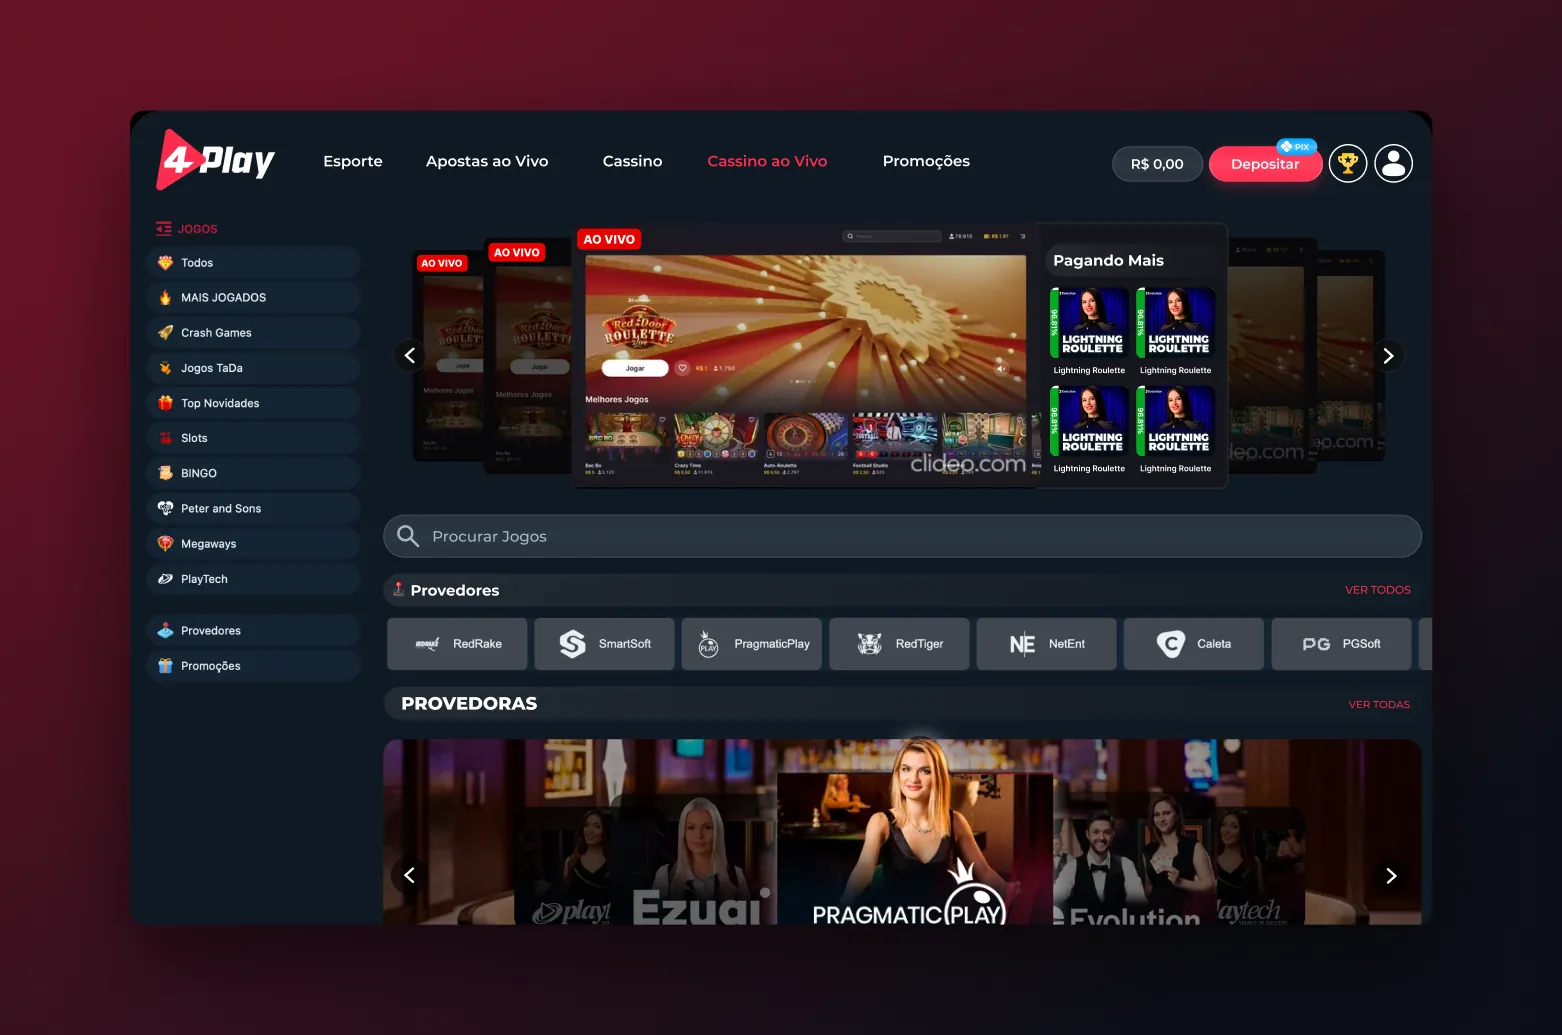
 View full page ↗
Bonuses
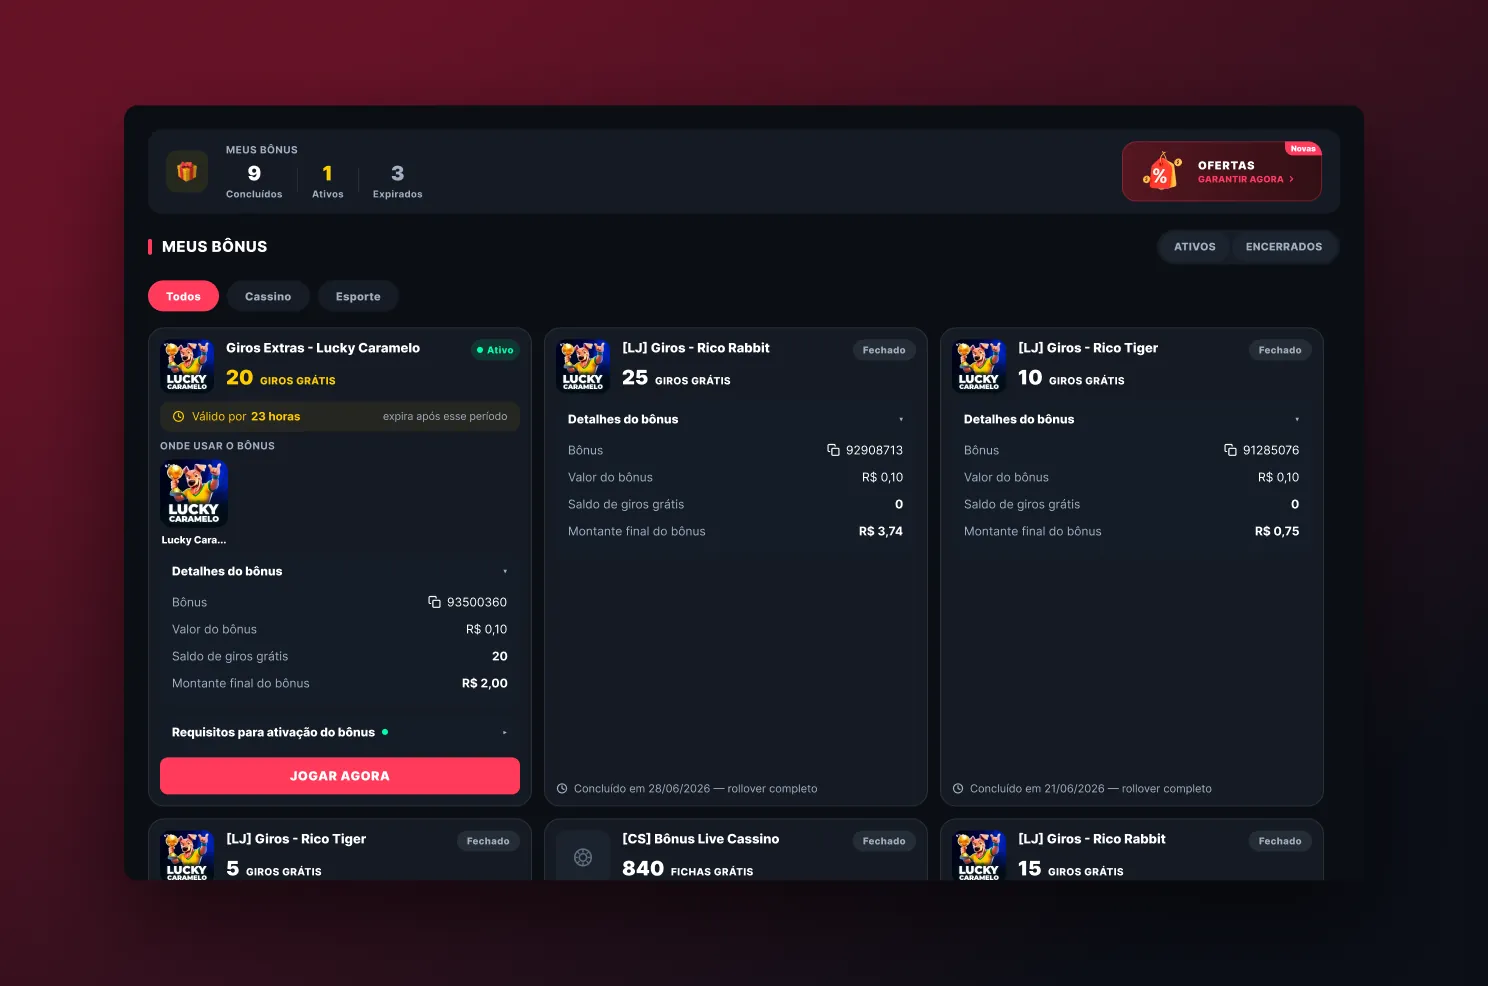
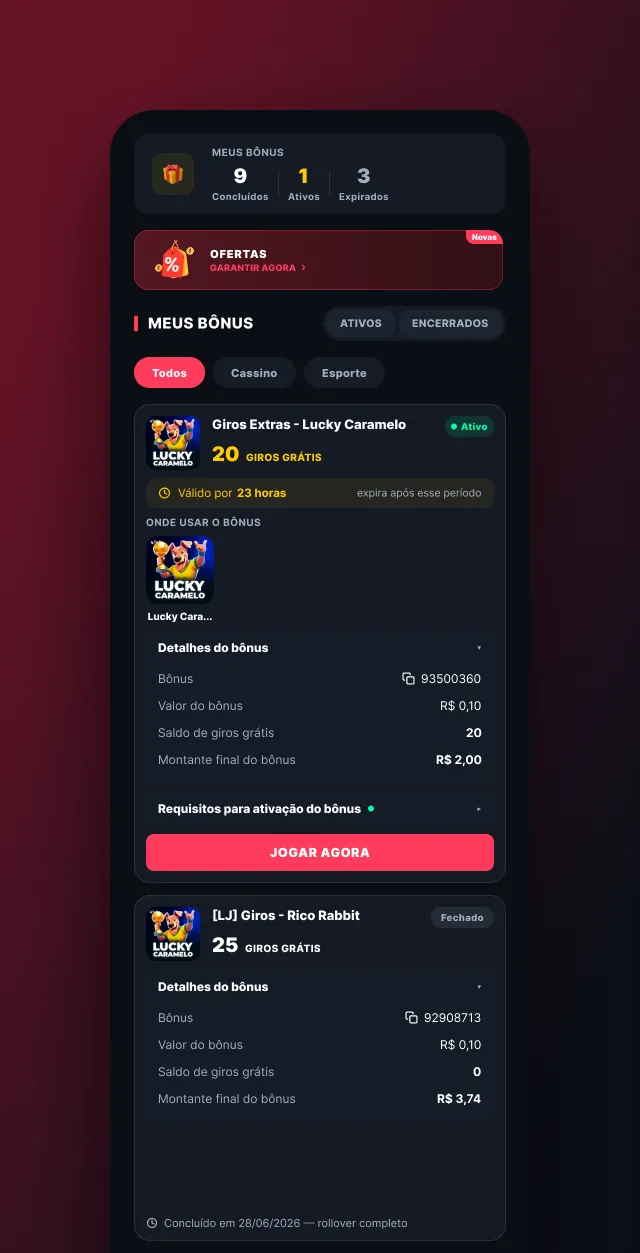
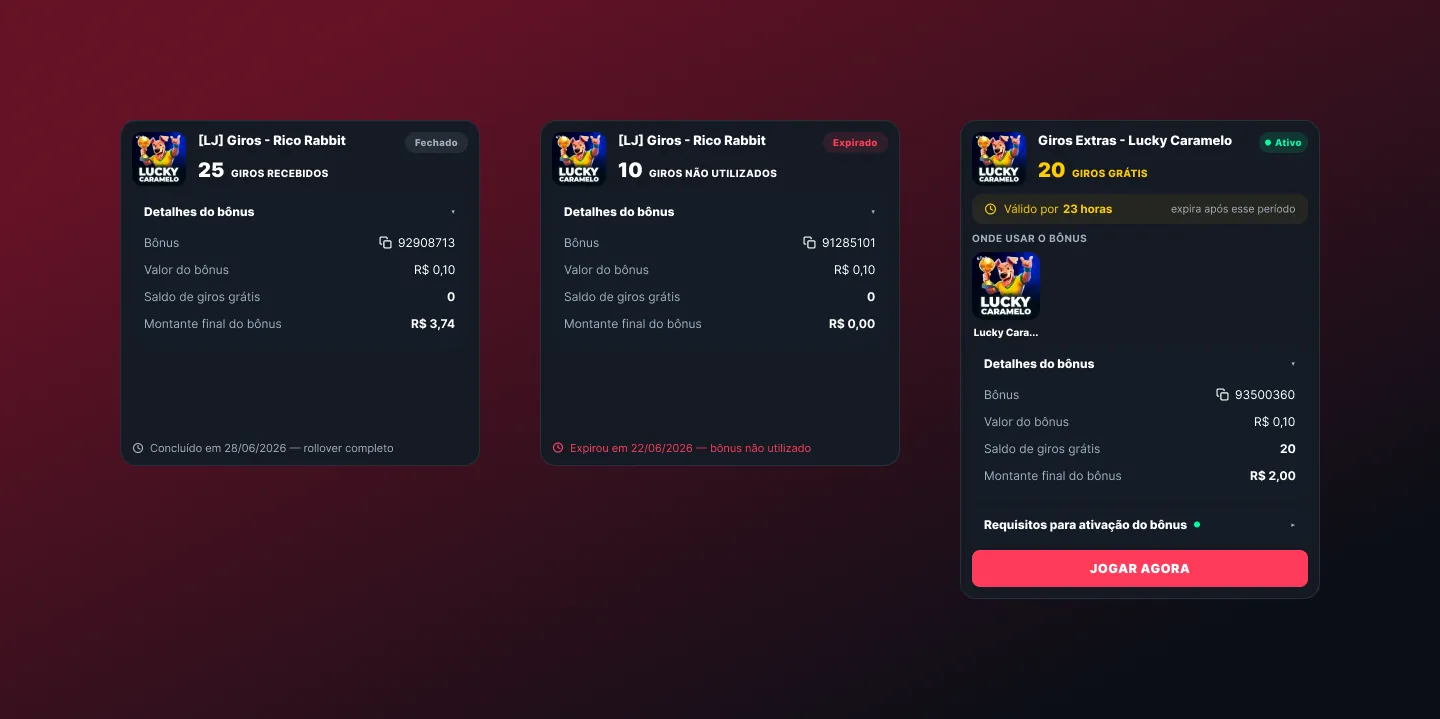
Bonus rules caused the most support questions. Cards now show state, progress and conditions before the player opts in.
Sports and content
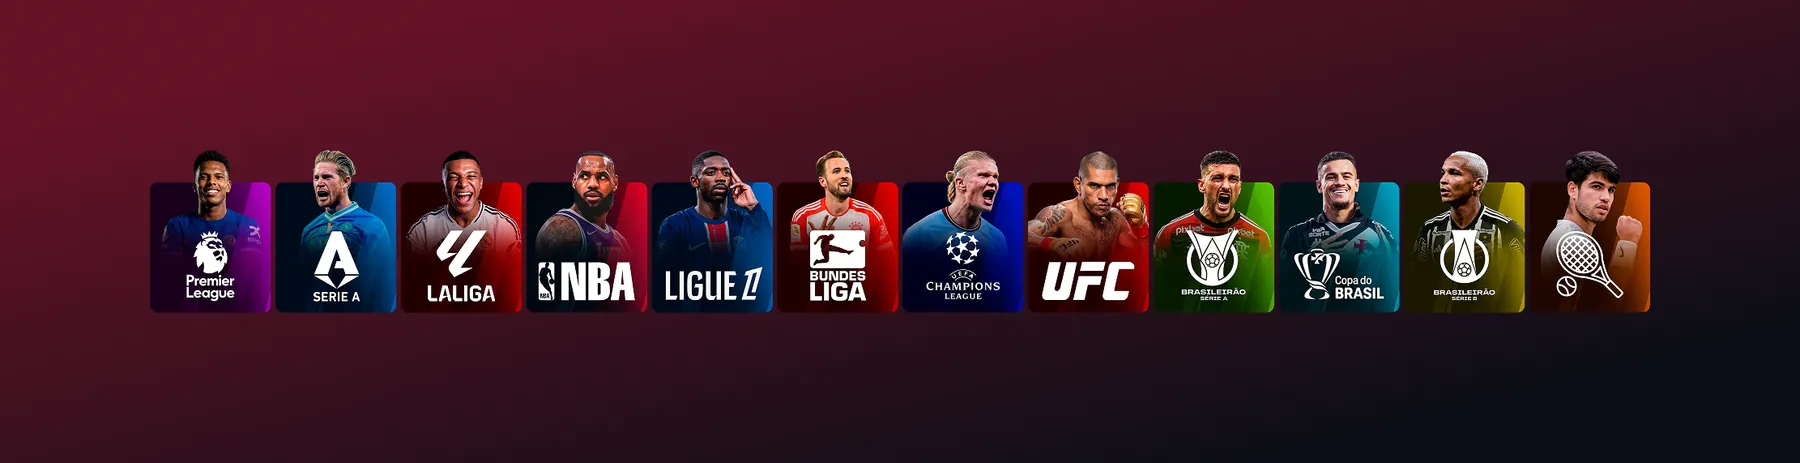
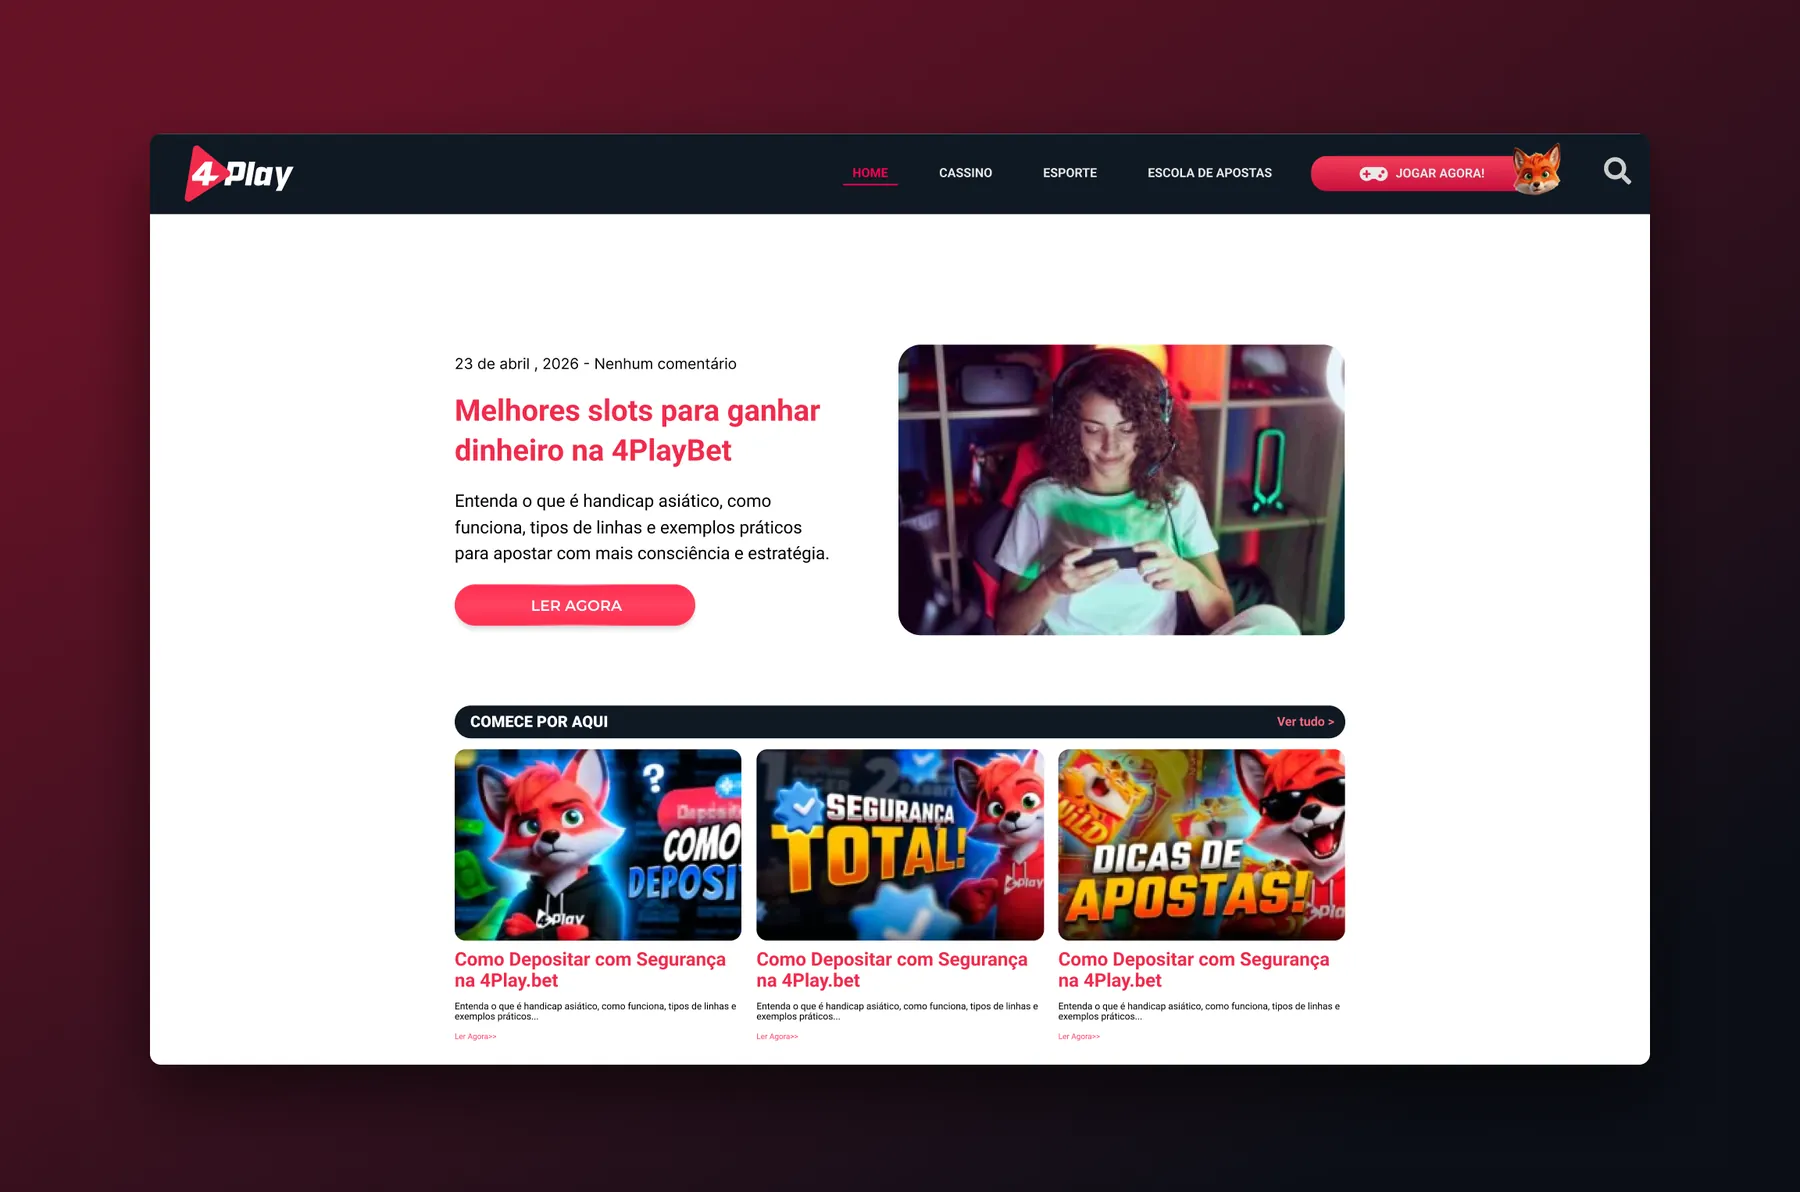
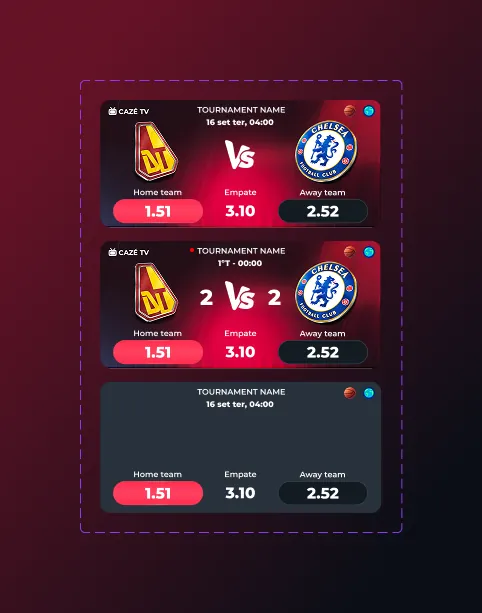
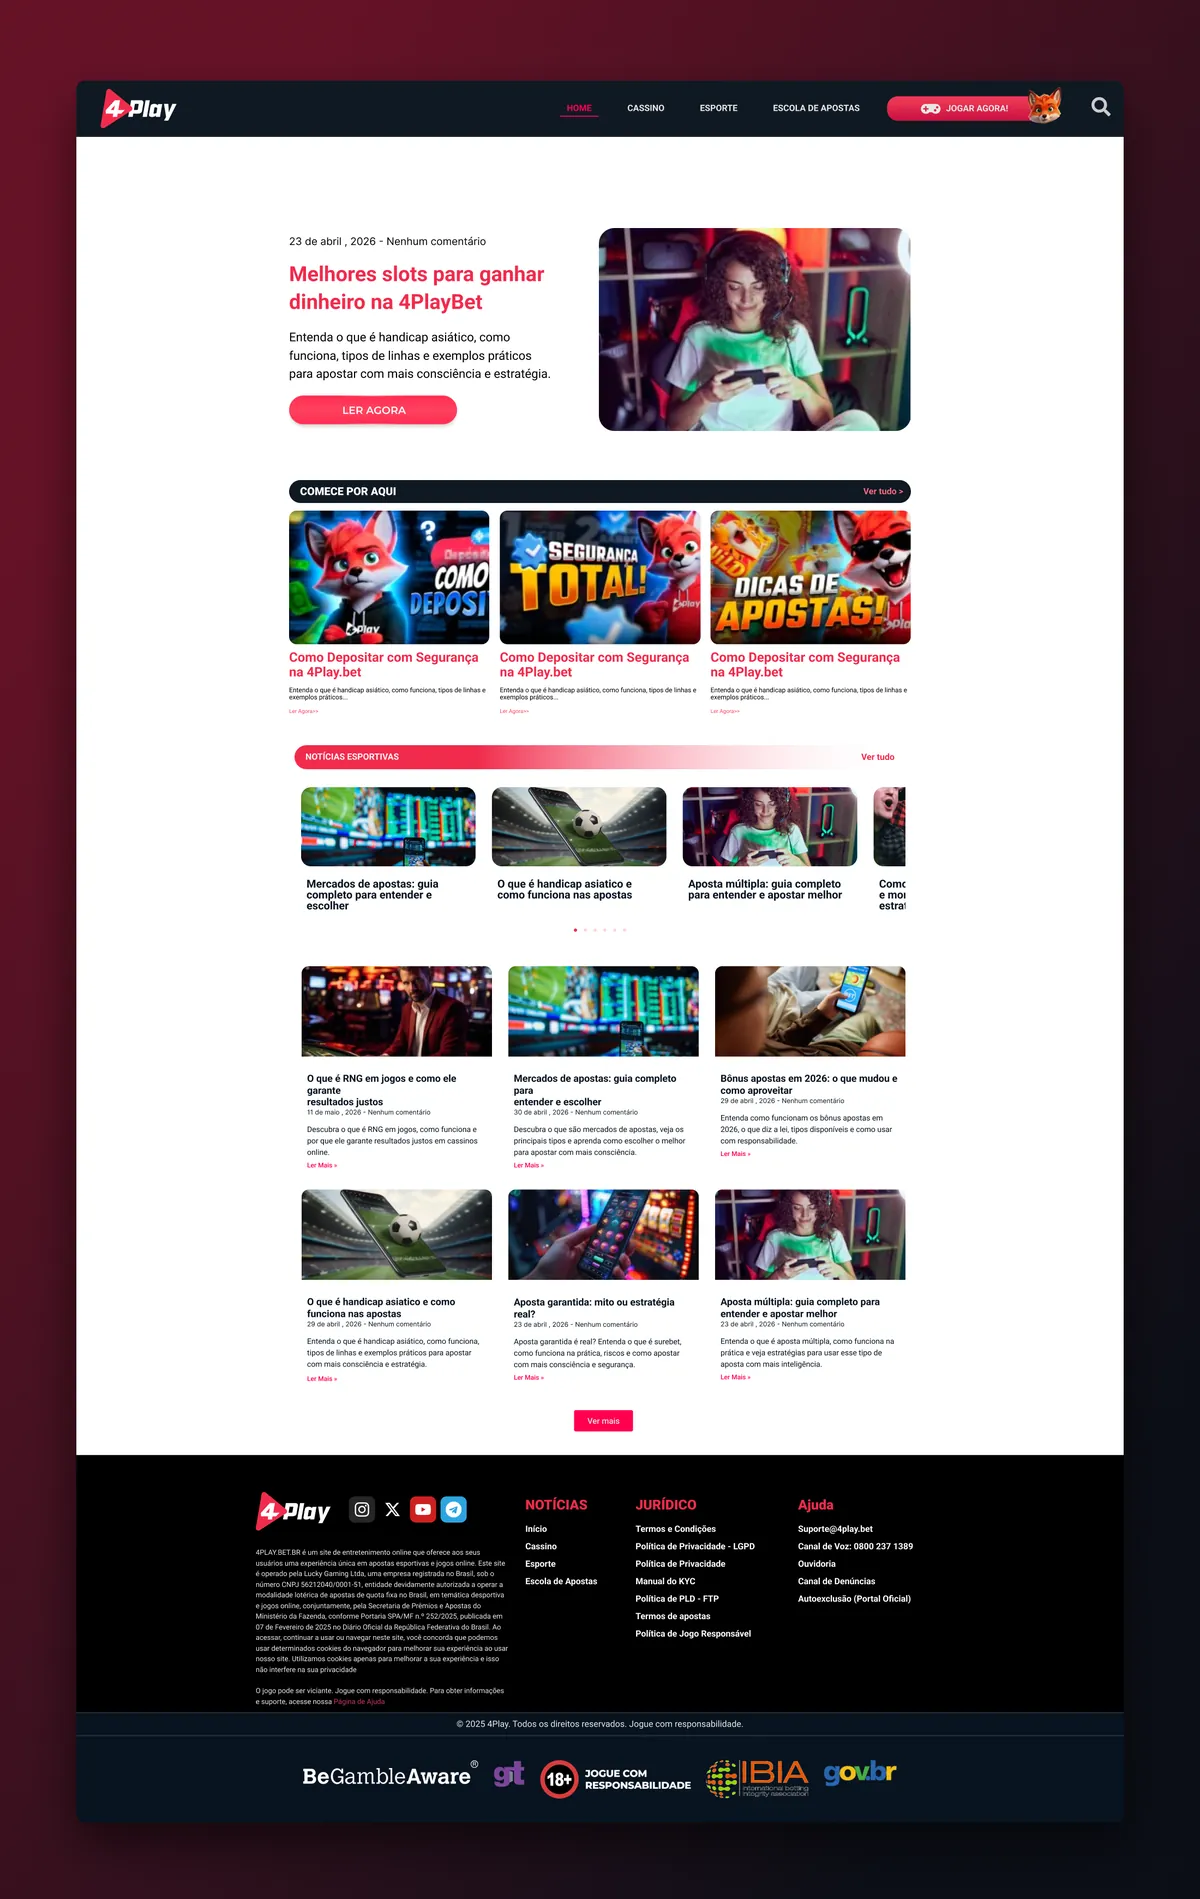
Players who arrive through sports behave differently. A league strip and highlight cards give them a fast path, and the blog brings search traffic into the product.
 View full page ↗
Location check
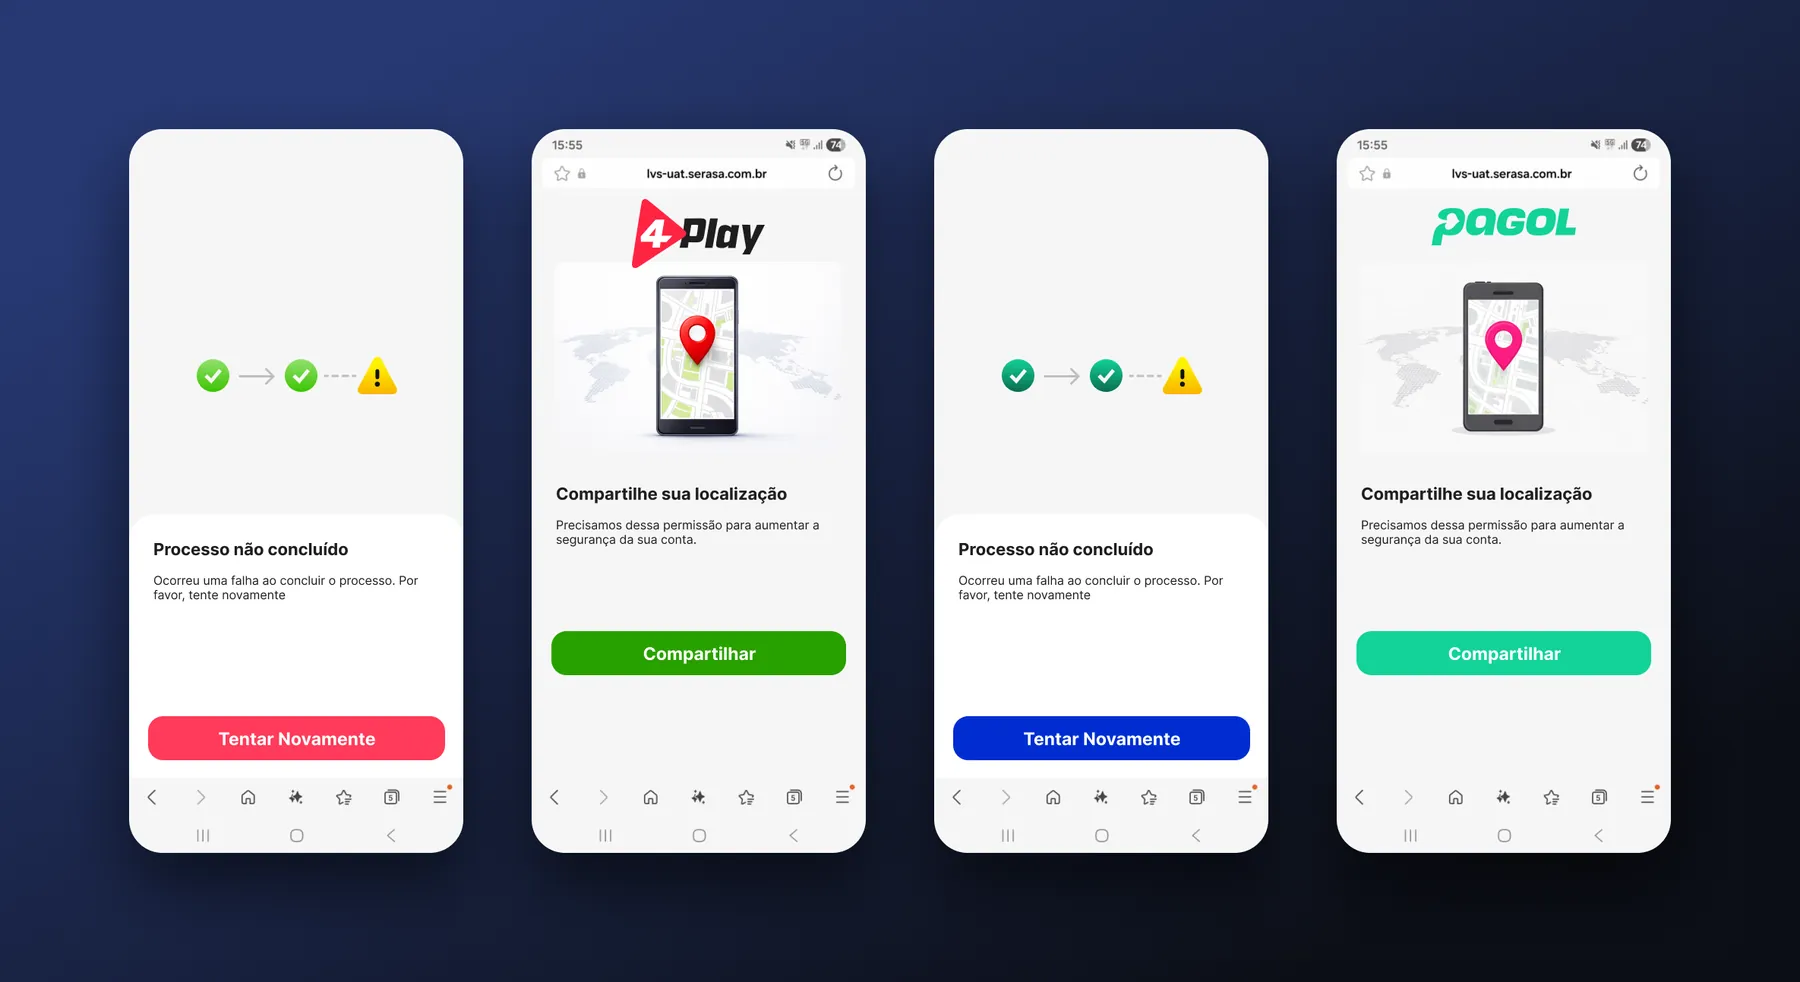
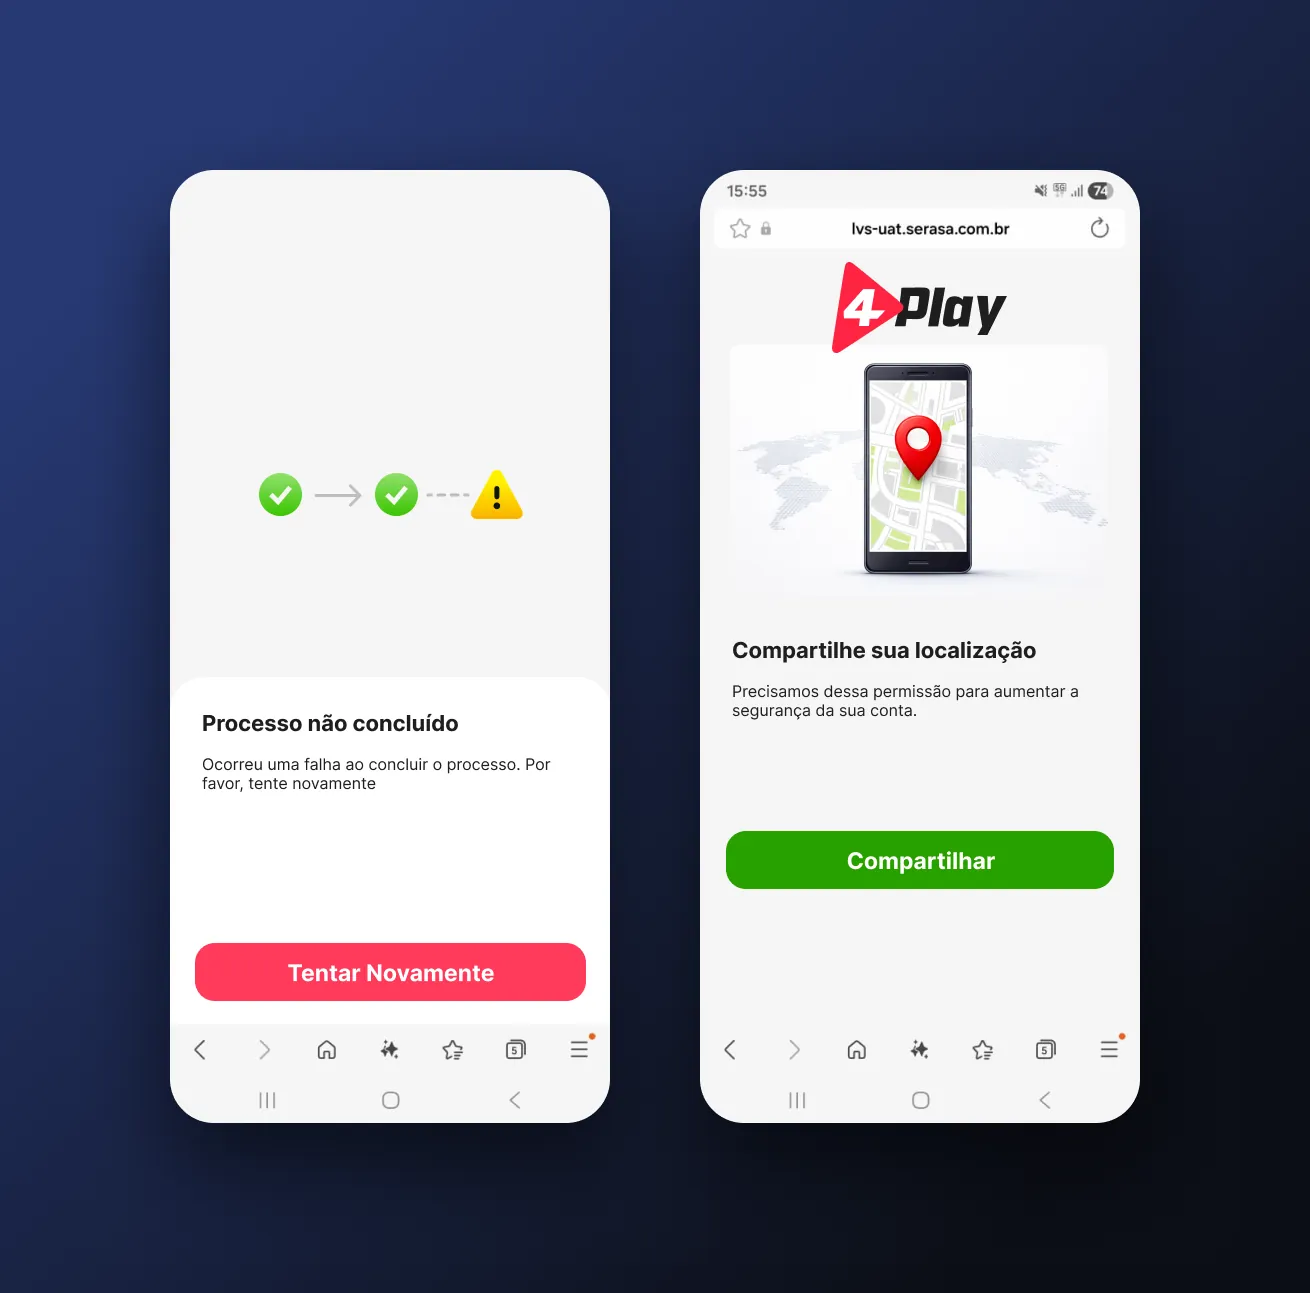
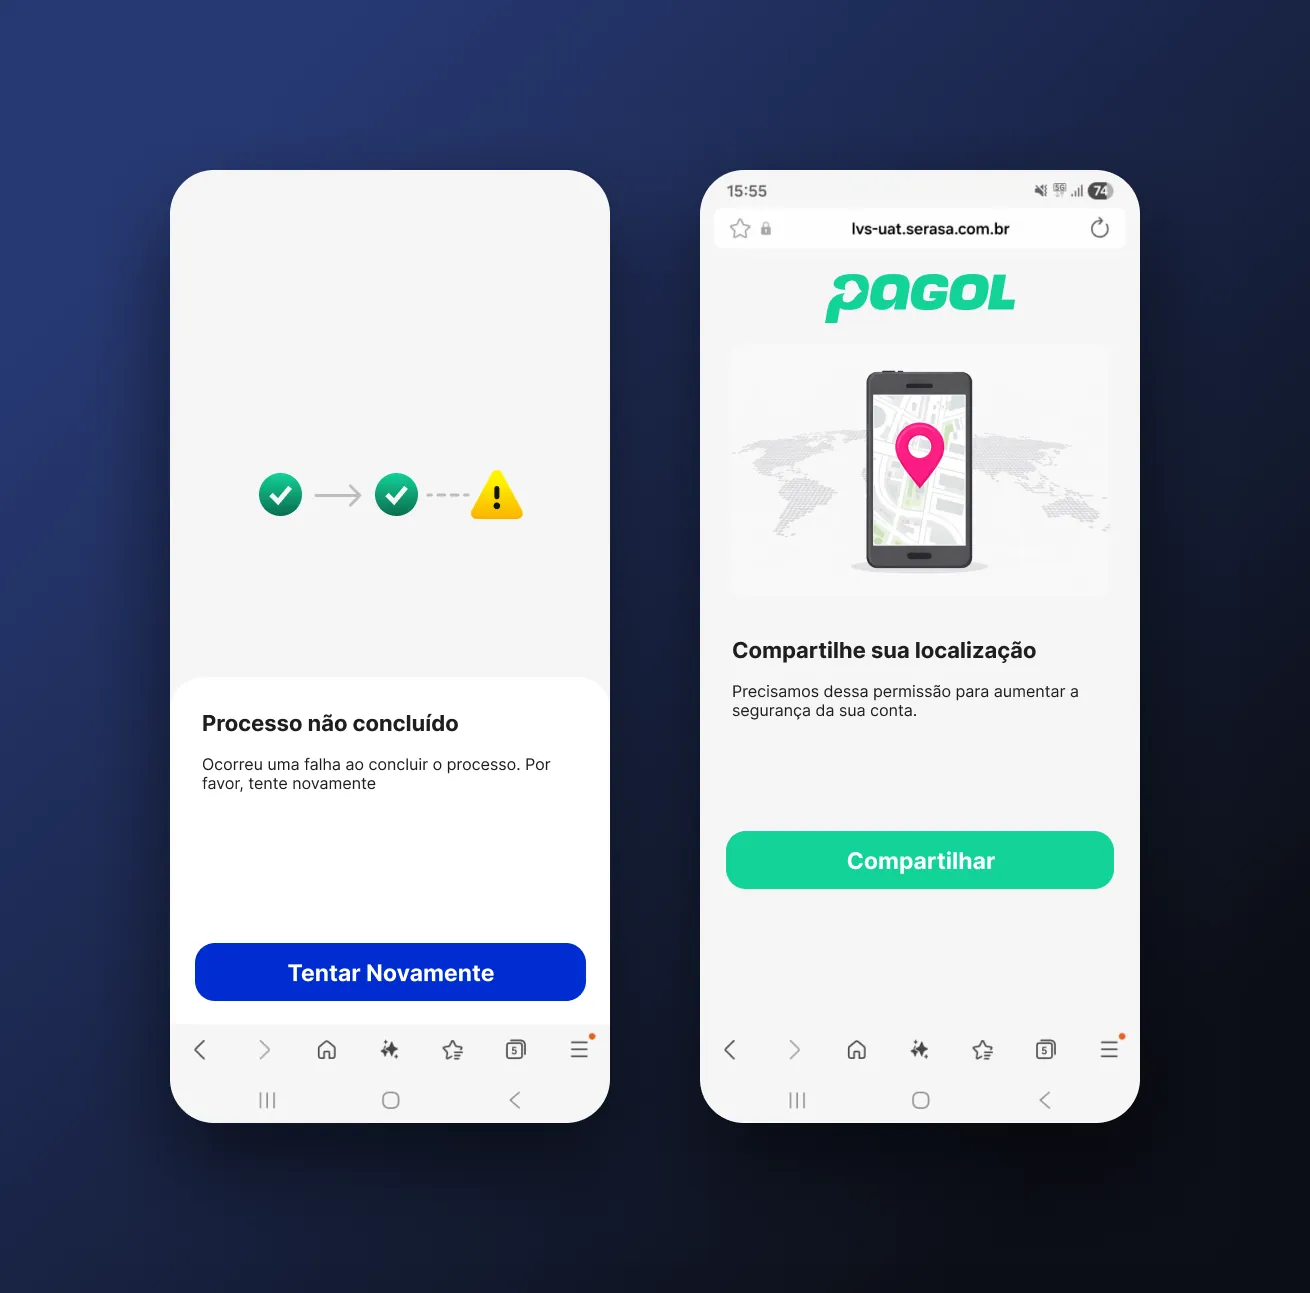
Regulation requires location. The flow asks for permission with a clear reason and always offers the next step when something fails, so the player is not left at a dead end.
Design system
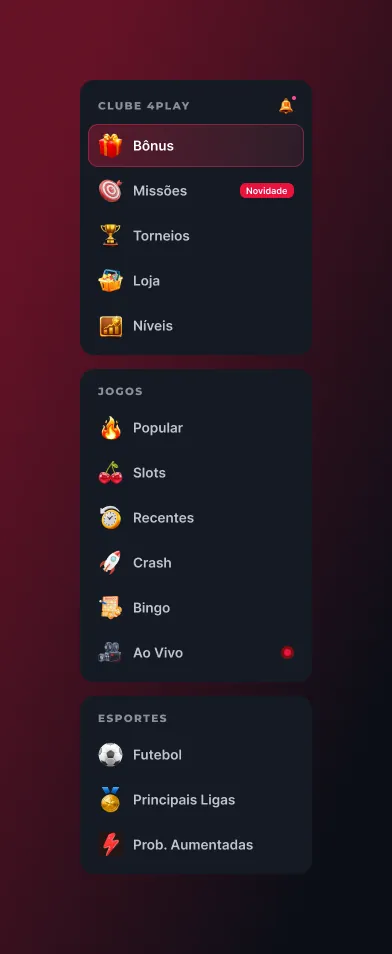
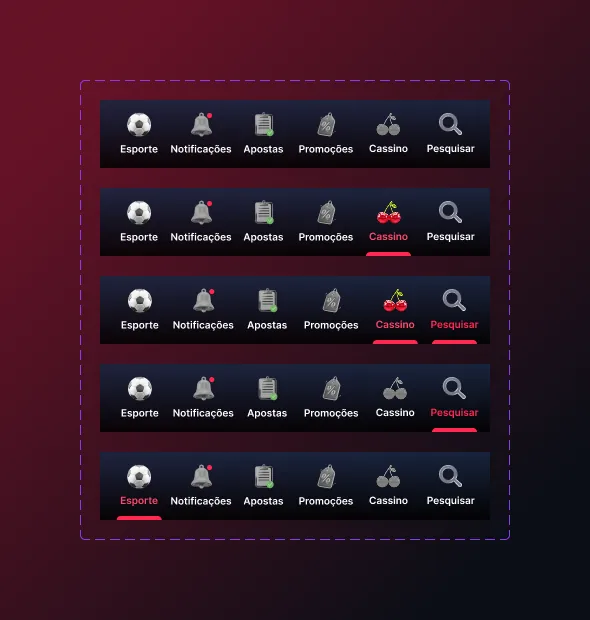
Everything above comes from one library of icons, navigation and cards, later shared with Pagol.

Some of the screens shown here may have changed since Brazil's betting regulation took effect. The screens come from my own design files. This page shows interface design only and is intended for adults (18+).
Sign-up or onboarding losing people? Start with a Flow Audit.
Ask for a Flow Audit